This post outlines the new graphics features available in ArrayFire v3.4: Vector Fields, Overlays
Vector Fields
We have added visualization support to render ArrayFire array objects as vector fields. An example of how to visualize vector fields is included in ArrayFire v3.4. A screenshot of this example’s output in multi-view mode is shown below, showcasing both static and dynamic vector field rendering.

Overlays
Previously, each graph (such as plot, hist, scatter, etc) was rendered in its own window (or view). Overlaying graphs was not supported. ArrayFire v3.4 now support graph overlays.
Each draw call in ArrayFire is either rendered to a whole window (single view) or to a view, which is a portion of the screen obtained in multiview mode.
The following image is an example of a graph overlay:
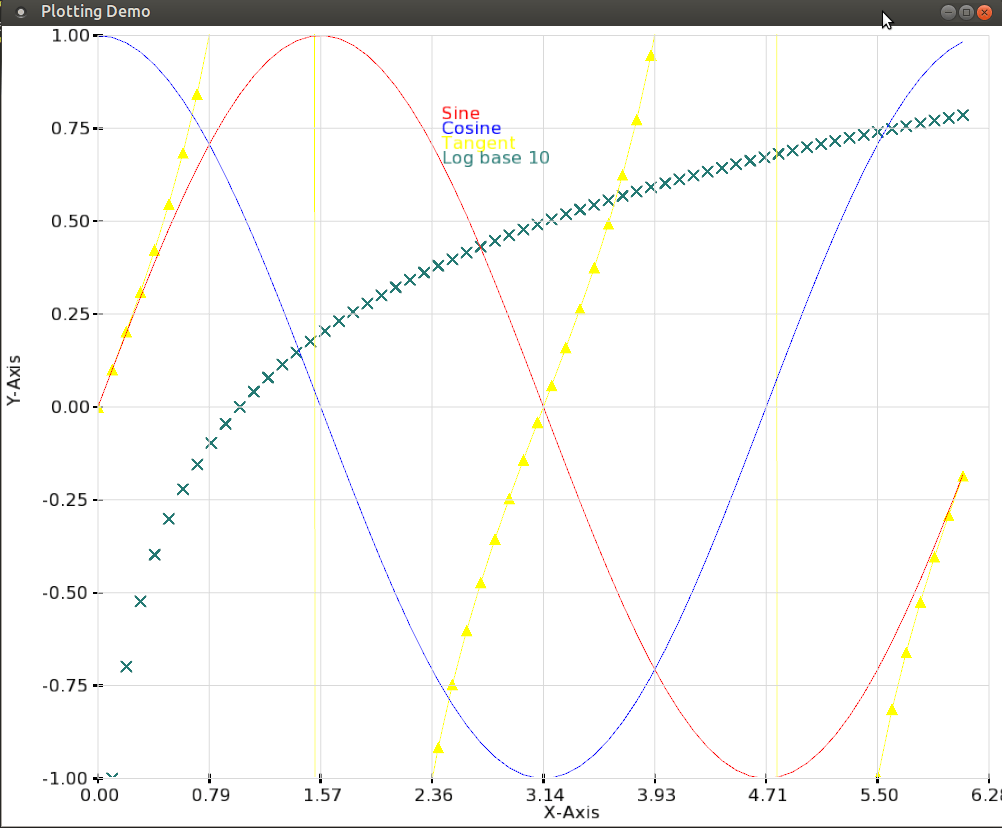
The following graphs support overlay if they are of same type of object (2d/3d):
| plot |  |
| histogram |  |
| surface |  |
| vector fields | |
Animations
ArrayFire v3.4 includes the following examples of producing fun animations based on simple equations: conway, conway_pretty, gravity, and julia fractal.


Behavioral Changes
In previous versions of ArrayFire, axes limits were computed automatically to fit the data. In ArrayFire v3.4, users are required to set axes limits, as shown below:
af::Window myWindow(800, 800, "2D Plot example: ArrayFire");

array Y;
int sign = 1;
array X = seq(-af::Pi, af::Pi, PRECISION);
array noise = randn(X.dims(0))/5.f;

myWindow.grid(2, 1);
// Set the axes limits to view (0,0), prior to v3.4 this was not needed
myWindow(0, 0).setAxesLimits(-2 * af::Pi, 2 * af::Pi, -1, 1, true);
// Set the axes limits to view (0,0), prior to v3.4 this was not needed
myWindow(1, 0).setAxesLimits(-2 * af::Pi, 2 * af::Pi, -1.25, 1.25, true);

for (double val=0; !myWindow.close(); )
{
    Y = sin(X);

    myWindow(0,0).plot(X, Y);
    myWindow(1,0).scatter(X, Y + noise, AF_MARKER_POINT);

    myWindow.show();

    X = X + PRECISION * float(sign);
    val += PRECISION * float(sign);

    if (val >af::Pi) {
        sign = -1;
    } else if (val < -af::Pi) {
        sign = 1;
    }
}
The code above produces the output below. You can find the complete example here.

Miscellaneous Change
Removed GLEW and replaced with glbinding.
Download
ArrayFire v3.4 can be downloaded from these locations:
Community
ArrayFire is continually improving through the addition of new visualization functions. We welcome your feedback:
- General discussion forums on the ArrayFire Google Group
- Live discussion chat on the ArrayFire Gitter
- Issue reports on the ArrayFire GitHub
Finally, as you find success with ArrayFire, we invite you to contribute a post to this blog to share with the broader community. Email scott@arrayfire.com to contribute to this blog.