The ArrayFire library attempts to make high-performance computing as easy as possible for scientists and engineers. Because many tasks need to be visualized, ArrayFire also provides a high-level interface to our Forge visualization library. In today’s “Learning ArrayFire from scratch” post we present an overview of ArrayFire’s visualization functionality and demonstrate how to use Forge to display data contained in af::array objects.
The Forge library is a general-purpose visualization tool for data stored on the GPU or related accelerator devices. By default, ArrayFire ships with Forge built-in. However; if you or your system administrator installed the “no-graphics” version of ArrayFire, Forge won’t be included.
ArrayFire provides several wrapper functions that simplify Forge’s interface when used with af::array objects. These functions primarily perform interop tasks including visualization range setting, copying data into OpenGL data structures, and generating an OpenGL window for display.
Setup
Before we can use Forge, we must create a window containing an OpenGL context. Creating an instance of the af::Window class will accomplish both of these tasks. Note, at present Forge must create and manage its own OpenGL context; however, we hope to change this in a future release. Once the window is created, you can use Forge’s drawing functions to visualize your data. Here is a basic example of how to create a window, set its title, and enter into a drawing loop:
const static int width = 512, height = 512;
af::Window window(width, height, "2D plot example title");

do{

//drawing functions here

} while( !window.close() );
Rendering Functions
As included in ArrayFire 3.3, Forge provides the following plotting capabilities:
| Function | Description |
|---|---|
| af::Window::hist() | Creates a histogram plot from input data and bins |
| af::Window::image() | Display an image |
| af::Window::plot() | 2D Line plot |
| af::Window::plot3() | 3D line plot |
| af::Window::scatter() | 2D scatter plot |
| af::Window::scatter3() | 3D scatter plot |
| af::Window::surface() | Visualize a 3D surface |
Full documentation on all plotting functions can be found in the rendering functions portion of the documentation.
Image
The af::Window::image() function can be used to plot grayscale or color images. To plot a grayscale image a 2d array should be passed into the function.
Let’s see this on a static noise example:
array img = constant(0, width, height);   //make a black image
array random = randu(width, height);      //make random [0,1] distribution

window.image(img);

Tweaking the previous example by giving our image a depth of 3 for the RGB values allows us to generate colorful noise:
array img = 255 * randu(width, height, 3);      //make random [0, 255] distribution
window.image( img.as(u8) );

Note that Forge automatically handles any af::array type passed from Arrayfire. In the first example we passed in an image of floats in the range [0, 1]. In the last example we cast our array to an unsigned byte array with the range
[0, 255]. The type-handling properties are consistent for all Forge drawing functions.
Plot
The af::Window::plot() function visualizes an array as a 2d-line plot. Let’s see a simple example:
array X = seq(-af::Pi, af::Pi, 0.01);
array Y = sin(X);
window.plot(X, Y);

The plot function has the signature:
void plot( const array &X, const array &Y, const char * const title = NULL );
Both the x and y coordinates of the points are required to plot. This allows for non-uniform, or parametric plots:
array t = seq(0, 100, 0.01);
array X = sin(t) * (exp(cos(t)) - 2 * cos(4 * t) - pow(sin(t / 12), 5));
array Y = cos(t) * (exp(cos(t)) - 2 * cos(4 * t) - pow(sin(t / 12), 5));
window.plot(X, Y);

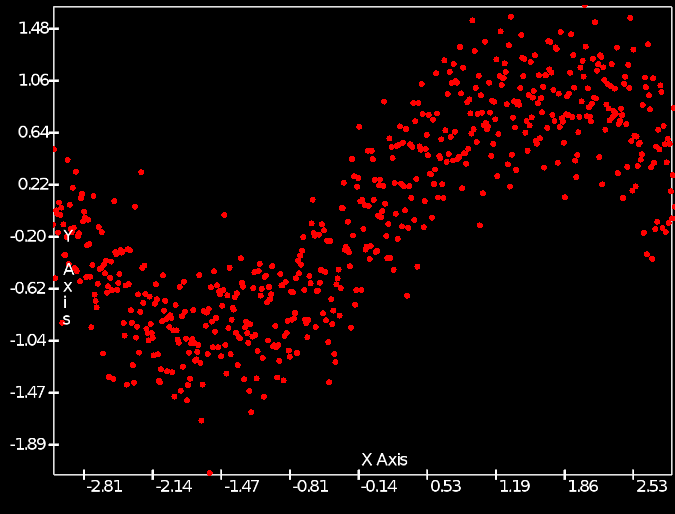
Scatter
The af::Window::scatter() function visualizes an array as a 2d-scatter plot. Let’s see a example:
array X = seq(-af::Pi, af::Pi, 0.01);
array noise = randn(X.dims(0)) /3.0f;
array Y = sin(X) + noise;
window.scatter(X, Y);
The scatter function has the signature:
void scatter( const array &X, const array &Y, af::markerType marker=AF_MARKER_POINT, const char * const title = NULL);
The af::markerType enum determines which marker will be drawn at each point.
It can take on the values of:
enum af::markerType {
    AF_MARKER_POINT
    AF_MARKER_CIRCLE
    AF_MARKER_SQUARE
    AF_MARKER_TRIANGLE
    AF_MARKER_CROSS
    AF_MARKER_PLUS
    AF_MARKER_STAR
};

Plot3
The af::Window::plot3() function will plot a curve in 3d-space.
Its signature is:
void plot3 (const array &in, const char * title = NULL);
The input array expects xyz-triplets in sequential order. The points can be in a flattened one dimensional (3n x 1) array, or in one of the (3 x n), (n x 3) matrix forms.
array Z = seq(0.1f, 10.f, 0.01);
array Y = sin(10 * Z) / Z;
array X = cos(10 * Z) / Z;

array Pts = join(1, X, Y, Z);
//Pts can be passed in as a matrix in the from n x 3, 3 x n
//or in the flattened xyz-triplet array with size 3n x 1
window.plot3(Pts);
//both of the following are equally valid
//window.plot3(transpose(Pts));
//window.plot3(flat(Pts));

Histogram
The af::Window::hist() function renders an input array as a histogram. In our example, the input array will be created with Arrayfire’s histogram() function, which actually counts and bins each sample. The output from histogram() can directly be fed into the af::Window::hist() rendering function.
const int BINS = 128; SAMPLES = 9162;
array norm = randn(SAMPLES);
array hist_arr = histogram(norm, BINS);

win.hist(hist_arr, 0, BINS);
In addition to the histogram array with the number of samples in each bin, the af::Window::hist() function takes two additional parameters – the minimum and maximum values of all datapoints in the histogram array. This effectively sets the range of the binned data. The full signature of af::Window::hist() is:
void hist(const array & X, const double minval, const double maxval, const char * const title = NULL);

Scatter3
The af::Window::scatter3() function visualizes an array as a 3d-scatter plot.
Its signature is:
void scatter3 (const array &in, af::markerType marker=AF_MARKER_POINT, const char * title = NULL);
The input array expects xyz-triplets in sequential order. The points can be in a flattened one dimensional (3n x 1) array, or in one of the (3 x n), (n x 3) matrix forms.

array X = randn(300);
array Y = randn(300);
array Z = randn(300);

array Pts = join(1, X, Y, Z);
window.scatter3(Pts);
The af::markerType enum determines which marker will be drawn at each point. It can take on the values of:
enum af::markerType {
    AF_MARKER_POINT
    AF_MARKER_CIRCLE
    AF_MARKER_SQUARE
    AF_MARKER_TRIANGLE
    AF_MARKER_CROSS
    AF_MARKER_PLUS
    AF_MARKER_STAR
};
Surface
The af::Window::surface() function will plot af::arrays as a 3d surface.
array Z = randu(21, 21);
window.surface(Z, "Random Surface");    //equal to next function call
//window.surface( seq(-1, 1, 0.1), seq(-1, 1, 0.1), Z, "Random Surface");

There are two overloads for the af::Window::surface() function:
void surface (const array & S, const char * const title )

// Accepts a 2d matrix with the z values of the surface
void surface (const array &xVals, const array &yVals, const array &S, const char * const title)

// accepts additional vectors that define the x,y coordinates for the surface points.
The second overload has two options for the x, y coordinate vectors. Assuming a surface grid of size m x n:
- Short vectors defining the spacing along each axis. Vectors will have sizes m x 1 and n x 1.
- Vectors containing the coordinates of each and every point. Each of the vectors will have length mn x 1. This can be used for completely non-uniform or parametric surfaces.
Conclusion
There is a fairly comprehensive collection of methods to visualize data in Arrayfire. Thanks to the high-performance gpu plotting library Forge, the provided Arrayfire functions not only make visualizations as simple as possible, but keep them as robust as the rest of the Arrayfire library.